Hurricane Ian Death Toll at 70 & Majority From Drowning

when flooded turn around don't drown sign

Streets of downtown in Fort Myers get flooded due to the surge of the Caloosahatchee River as Hurricane Ian hit the West Coast of Florida as Category 4 storm, on Wednesday, Sept. 28, 2022. Drowning has emerged as the top cause of death from the storm.

Most of the deaths in Hurricane Ian were from drowning, according to official accounts of fatalities from a storm that has killed at least 70 people, according to authorities.

Officially, 25 deaths have been tied to Hurricane Ian, according to reports from medical examiner offices, but authorities are reporting far more deaths in hard-hit areas.

Combining tallies from the Florida Medical Examiners Commission with other deaths reported by sheriff offices on Saturday, Hurricane Ian has killed 71 people in Florida.

Fatality numbers are likely to rise in the coming days. Rescue teams also haven’t been able to reach all areas hit by Ian, with an unknown number of people still missing from the storm.

On Saturday, Lee County’s sheriff announced 35 deaths from Hurricane Ian in that hard-hit jurisdiction alone, nearly triple the official count for Lee released the same day by the Florida Medical Examiners Commission.

“It is with a heavy heart that I say that number,” Sheriff Carmine Marceno said in a Facebook video post.

Lee County accounts for half of the Ian deaths in tallies from medical examiner offices across Florida. Those reports show floodwaters were the greatest danger from the storm. Of the 25 official fatalities in those reports, all but five listed drowning as a cause of death. 

Video of sharks swimming in the streets of Fort Myers, Florida

Hurricane Ian Map with Wind Speeds

Hurricane Ian Map with wind speeds
Daily wind speeds and tracking map of where the Hurricane Ian storm is headed
wind map forecast hurricane ian florida
Wind map forecast Hurricane Ian Florida


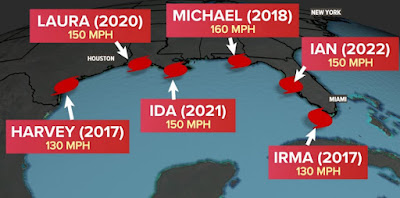
Map of Category 4 & 5 Hurricanes on the Gulf Coast since 2017

map of category 4 hurricanes on Gulf Coast since 2017
Map of category 4 hurricanes on the Gulf Coast since 2017

Ian now a category 4 hurricane joins the ranks of some of the most powerful to make landfall on the Gulf Coast since 2017. Here's a map of some major Category 4 and 5 hurricanes that have struck the United States since 2017.  

hurricane ian map with wind speeds
Hurricane Ian Map with wind speeds

See these hurricane disaster maps we previously published here. , , 

Fort Myers Beach is Under Water & Houses Floating Away

FEMA flood map hazard map


We are also looking for feedback on how the wireless carriers did providing emergency cell phone service in Florida during Hurricane Ian.  

Houses are destroyed and some are floating away as Ian's eyewall hammers southwest Florida. This is video from Fort Myers Beach, Florida off Estero Blvd by Loni Architects 


Storm Surge Maps Hurricane Ian in Fort Myers & Coral Cay, Florida

Storm Surge Map Hurricane Ian in FloridaNOAA Hurricane Storm Surge Map

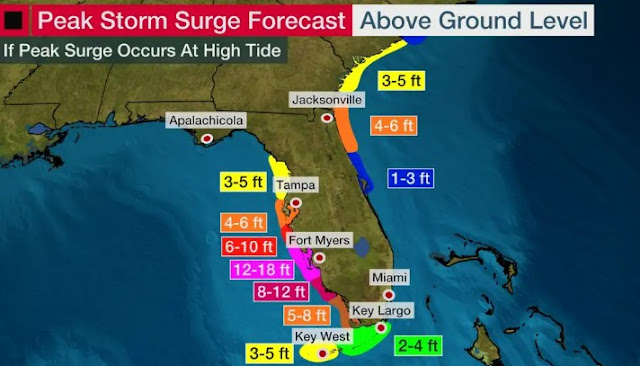
Potential Storm Surge Flooding Map in Fort Myers and Cape Coral

Areas greater than 1-9 feet above the ground near the ocean

Fort Myers model flood map
Fort Myers Model Flood Map

Peak Storm Surge Forecast Hurricane Ian

power outage map florida hurricane ian

Power outage map Florida Hurricane Ian

Day 2 through Friday AM

For more information on previous hurricanes in Florida see this link. 

Portland Air Quality Map


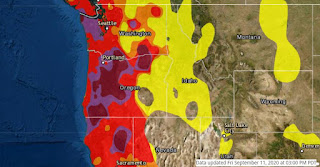
Portland’s air quality was the worst of major cities in the world Friday morning, due to Oregon and Washington wildfires
Portland air quality map
Portland Air Quality

Oregon Smoke & Air Quality Forecast Maps

Oregon air quality forecast map

Oregon Smoke & Air Quality Maps


western USA smoke map


Portland Metropolitan Area Fire, Air Quality & Evacuation Maps


Portland Metropolitan Area Fire Map

The Northwest Fires within Oregon and Washington


Portland, Oregon Metropolitan Fires Map


Map of Active Wildfires in the United States


Active Wildfires in the United States

Essay on California Wildfires

A wildfire is a destructive and uncontrollable fire that burns down the forest. Wildland fires erupt worldwide in different seasons and are caused by various issues. Even though fires can be beneficial, uncontrolled occurrences have proved harmful to both people and the environment. Examples of countries that have been victims include South Africa, Brazil, and Canada. Like all these, California has written its history based on the numerous forest fires that have been occurring, putting the country at risk of losing all its natural heritage. 2007, 2008, 2017, 2018, and 2020 have been the toughest on California as the country has witnessed some of the largest fires in history, losing more than 100,000ha of land (Keeley & Syphard, 2021). These occurrences continue to affect California in many ways regarding environmental degradation. Thus, this essay on California wildfires seeks to present the issue of wildfires in the country and focuses on establishing the history of the fires, their mechanisms, and the possible methods that can be used to prevent them.

History of California Wildfires

According to the California Department of Forestry and Fire Protection (CAL FIRE), the country has witnessed more than 10,000 incidents of wildfires. Incidentally, the statistical records held by the agency from the time of its inception, which is 1932, allude to an exponential increase in the number of forest fires over an 80-year timeline. Almost all the fire scenarios have consumed hundreds of hectares of land forests, leaving the country to deal with severe cases of environmental damage. The most significant case to have been recorded in the history of California is the 2020 August Complex Fire. In this incident, 38 separate fires, which have since been classified as one, ravaged over 418,000ha (Keeley & Syphard, 2021). The same scenario was witnessed with the LNU complex fire, even though it did not result in a merger. However, the results of their occurrences have forced the citizens to live with the repercussions of environmental and property damage.

California’s cases of wildfires call for the initiation of research studies, especially in identifying the probable root causes. According to Li & Banerjee (2021), California has been experiencing wildfires for more than 80 years. Surprisingly, only 1% of the reported instances can be considered large fires. However, this does not rubbish the fact that all the cases have contributed to the loss of property and lives. Hence, the quest to establish real causal factors remains, and all government agencies and citizens must work together to ensure they are curtailed. Keeley & Syphard (2021) claims that most forest fires can be linked to rapid changes in climate. Perhaps this argument might hold some ground. However, whether the variations have been constant for the entire period remains a mystery, as notable changes in the size of the forest fires have been seen in the last decade. In contrast, California has had to battle wildfires since the early 1900s. Thus, more critical research studies deserve to be conducted to ensure the findings being presented to the public are accurate and a true reflection of the state of the country’s situation.

Mechanism

California’s woes with wildfires demand that we understand two fundamental mechanisms, which perhaps have been vital in the ignition and propagation of the fires. First, CAL FIRE’s research holds that human factors play a significant role in the occurrence of wildfires, starting in more than 95% of the cases. These factors include unchecked or improperly put-out campfires, cigarette butts, and in some cases, arson. A sample case of arson is the 2003 Old fire, which the pyromaniacs started, which led to the destruction of large forest reserves (Keeley & Syphard, 2021). Such occurrences, among other human causes, have contributed to the massive destruction of the forested land. Despite the statistical proof that human factors have been the primary cause, it is also evident that some natural causes have played a role in the number of wildfires in the country. For example, the McDonald fire, which consumed more than 1000ha of land in Lassen County, was started by light. Thus, the larger cause must be curtailed to bring about a reduction in the incidences.

Another mechanism worth exploring is the propagation of fires. According to Li & Banerjee (2021), climate change is the primary promoter of forest fires. Specifically, California has been witnessing many dry conditions, with the strength of wind continuing to increase each passing day. As a result, any slight occurrence of fire, whether small or large, is easily propagated. The Diablo and Santa Ana winds are the greatest culprits in this case, especially since they play a role in stroking the fires, leading to more damage. These scenarios communicate the urgency with which the government must act to ensure proper climate intervention measures are implemented, specifically to ensure forest fires are minimized.

Prevention and Mitigation

California’s wildfires have proved to be a nuisance to the environment, endangering the people’s health and putting the country’s economy at risk. However, developing the most workable solutions is impossible without in-depth research into the issues. Li & Banerjee (2021) have attempted to focus on this aspect, presenting an elaborate statistical analysis of the causes of wildfires from a sample of century-long occurrences. The results show that climate change has been responsible for most large fires, giving the government a chance to leverage a targeted approach to the issue. In essence, the numerous reports published by CAL FIRE can complement the study’s recommendations to ensure a workable solution is obtained.

Most wildfires start due to human negligence. Therefore, California’s government has come up with a multi-agency team to conduct extensive monitoring and inspection of the environment to ensure all the possible causes of wildfires are thwarted. Also, there has been mass sensitization of the public to ensure that people can understand the implications of their actions on the environment, especially concerning the continuous occurrence of fires.

Ultimately, CAL FIRE, in collaboration with various other teams, including the Forest Management Taskforce, has come up with environmental conservation programs. The programs have involved the removal of dead tree remains and the clearing of bushes. Even though these measures may appear minimal, the impacts are pretty noticeable, specifically when it is considered that these dry materials and light bushes have been contributing to the rapid propagation of wildfires. Hopefully, these measures will contribute to reducing the fires and allow the citizens to reclaim the lost glory.

Conclusion

This essay on California wildfires presents the issue as a critical part of history, especially when it is considered that the country has had to battle them for more than eight decades. The fires are caused by human factors and are fueled by the rapidly changing climate. Therefore, proper control of the situation demands that CAL FIRE develop procedures to eliminate the root causes and implement strict management measures.

Are you interested in getting a customized essay like the one above? You might want to consider ordering them from the following essay writing service CustomWritings.com. The company has professional academic writers who can write your research papers and homework assignments from scratch. You can consider placing your order with them as the prices are affordable.

References

Keeley, J. E., & Syphard, A. D. (2021). Large California wildfires: 2020 fires in historical context. Fire Ecology, 17(1), 1-11. https://doi.org/10.1186/s42408-021-00110-7

Li, S., & Banerjee, T. (2021). Spatial and temporal pattern of wildfires in California from 2000 to 2019. Scientific Reports, 11(1), 1-17. https://doi.org/10.1038/s41598-021-88131-9

Disaster Relief ETF (FEMA) Launches for Hurricane Season

FEMA ETF

The Atlantic hurricane season is in full swing, and a new exchange-traded fund that focuses on disaster recovery has launched just in time for it.

The first-of-its-kind Procure Disaster Recovery Strategy ETF invests in companies working to reduce risk and motivate sustainable recovery from natural disasters around the world.

“Our partners at VettaFi and the team that helped construct this index looked at things like hurricanes, floods, droughts, wildfires, tornadoes — natural disasters that are occurring all around the globe — and what companies are actually stepping up to help us in those efforts,” ProcureAM CEO Andrew Chanin told CNBC’s “ETF Edge” this week.

The ETF, which trades under the ticker FEMA, bundles companies across sectors including industrials, energy and materials. “These are the companies that really help bring our lives back to normal when we need them most,” Chanin said.

Holdings in the FEMA ETF include communications tech company Fujitsu, risk assessment firm Verisk Analytics, Jacobs Engineering Group and cloud computing firm VMware.

Chanin calls the ETF “a very diversified basket,” including companies in various industries that work on disaster prevention as well as recovery.

Separately, he told CNBC that creation of the FEMA ETF was inspired by Hurricane Katrina, which hit the Gulf Coast in 2005. While attending school at Tulane University in New Orleans, Chanin considered the financial and human tolls that come with major natural disasters.

“One of the first things I did when I was down in New Orleans, when we heard Hurricane Katrina coming, was everyone was going to Home Depot to buy plywood. And, then you need to go and you need to purchase more stuff — whether it’s shingles, whether it’s things to repair, whether it’s paint — after these disasters,” Chanin said. “It’s a wide range of companies that are all involved throughout different parts of the life cycle.”

Since 1980, the U.S. has undergone 323 weather and climate disasters totaling $2.2 trillion in costs, according to the National Centers for Environmental Information, an agency operated by the National Oceanic and Atmospheric Administration.

What is Disaster Relief & How Does Funding Work?

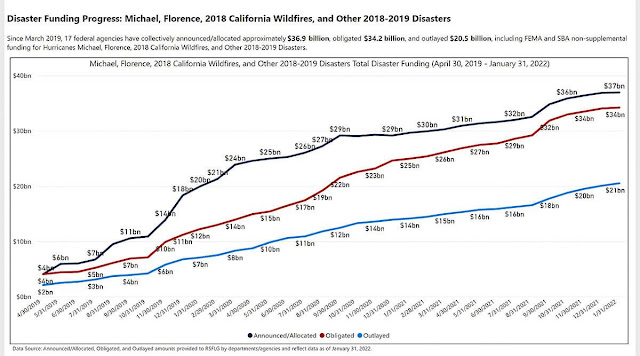
FEMA natural disaster funding growth chart

Disaster relief is money paid out to those suffering as a result of natural (or man-made) disasters. 'Natural disasters' can mean lots of different things. To be clear, we're not talking about run-of-the-mill weather events like snowstorms or hurricanes, but catastrophes such as earthquakes and volcanic explosions.

Sometimes disaster relief is awarded by the state in question, or by a higher authority such as the United Nations. It can also be collected from private donors who are both located within or outside that area.

It's not just aid that victims receive either—disaster relief covers all sorts of things, including medicine and food for starving people.

In some cases, disaster relief may be requested by a country itself (i.e., when it's been hit by an earthquake). In other cases, nearby countries will donate supplies to those affected on their own initiative because they want to help out and they know it'll be appreciated—this sort of thing happens mostly among neighbouring nations with good relationships between them already

Is disaster relief taxable?

If you receive a disaster relief payment, it is considered income and must be reported on your tax return. If you receive these payments because of a loss from a federally declared disaster, you can deduct any casualty losses related to the disaster on your federal tax return. You can claim this deduction only if it’s more than any insurance reimbursement you received for the loss and if you itemize deductions.

How is disaster relief funded?

There are several ways that disaster relief can be funded, including by federal and state governments, through private donations, in-kind donations and corporate donations. International funding and loans may also be available to support relief efforts.

Federal funding for disaster relief primarily comes from the Federal Emergency Management Agency (FEMA), under the jurisdiction of the United States Department of Homeland Security. The Stafford Act mandates that FEMA is required to provide at least 75 percent of a state's costs for each program it finances; however, the state would pay 25 percent of such costs if it has sufficient funds. Other federal agencies can also provide funding after a disaster occurs. For example, the Small Business Administration offers low-interest loans to businesses impacted by disasters as well as non-profit organizations which provide services to them.

Who manages disaster relief accounts?

When you give to a disaster relief account, the money is managed by an individual organization. The organization will use the funds to provide whatever help is needed in the given situation—shelter, food, medicines, etc.—and these accounts are not part of the federal budget.

Where do donations go for disaster relief efforts?

As you're donating to a disaster relief effort or otherwise supporting their efforts, it's important to know that the funds are being allocated in a variety of places. You may think that all the money is going toward providing food, water, and shelter for those affected by a natural disaster—but it's actually much more complex than that. “While we do provide food, water, and shelter for those affected by disasters...we also work on providing medical supplies, rebuilding communities, repairing critical infrastructure like water systems and roads, educating children who have lost schools and classrooms in a disaster…[and] training for future disasters," said Susan McMaster at Direct Relief International.

Generally when you donate to a well known organization that sends money overseas then you are donating to a large centralized fund that will decide what the money should be spent on.

Generally, when you donate to a well-known organization that sends money overseas, then you are donating to a large centralized fund that will decide what the money should be spent on. You can help people who have been affected by a disaster in many ways: by making a financial donation, giving non-financial support or volunteering your time

Donations are tax deductible and may help reduce the tax you pay at the end of the year. When you donate to reputable charities, your donations are used to help people who have been affected by disasters around the world. Donations also help with recovery efforts after the disaster has occurred

What are the major disasters in the last 5 years?

Hurricanes Harvey, Irma, Maria, 2017 California Wildfires, and other 2017 Disasters

Since September 2017, Congress has passed three supplemental disaster appropriations (Public Laws 115-56, 115-72, and 115-123) which together with FEMA DRF and SBA DL funds, are available to help communities recover from Hurricanes Harvey, Irma, Maria, the 2017 California Wildfires, and other 2017 disasters. Below is a time series visualization which shows the total spending for these disasters since March 31, 2018.

Hurricanes Michael and Florence, 2018 California Wildfires, and other 2018 and 2019 Disasters

Since October 2018, Congress has passed two supplemental disaster appropriations (Public Laws 115-254 and 116-20) which together with FEMA DRF and SBA DL funds, are available to help communities recover from Hurricanes Michael, Florence, the 2018 California Wildfires and other large 2018 and 2019 disasters. Below is a time series visualization which shows total disaster funding for these disasters.

Map of Natural Disasters Around the World Since 1900


Natural disasters are unavoidable and prevalent in human history, but it doesn't diminish our collective shock when they strike. Here are a few examples of natural disasters that hit the news last year:
  • A 7.2 magnitude earthquake struck Haiti, killing more than 2,000 people. Thousands of homes were damaged or destroyed as a result of the storm.
  • Rai, a super typhoon that hit the Philippines, killed 375 people. Winds gusted up to 120 miles per hour throughout the storm (193 kph)
  • More than 300 people have been killed by landslides in China's Henan province.
  • More than 200 people have died as a result of historic flooding in Germany and Belgium.
  • Hurricane Ida battered the Gulf Coast, killing 91 people across nine U.S. states
These are just a few of the countless incidents that rounded out a year filled with disasters.

Our World in Data produced the interactive dashboard above using data from EM-DAT, the International Disaster Database. The database attempts to rationalize disaster preparedness decision-making and offer an objective foundation for vulnerability assessment.

Total Natural Disaster Deaths in the Last Decade (2010-2019)

Natural disasters have claimed the lives of around 60,000 individuals each year over the last decade. This equates to 0.1 percent of all deaths on the planet.

The graph below shows the overall number of deaths caused by natural disasters during the last ten years.

Type of Natural Disaster Total Deaths (2010-2019)
Earthquakes 267,480
Extreme Temperatures 74,244
Floods 50,673
Storms 27,632
Droughts 20,120
Landslides 10,109
Volcanic Activity 1,363
Wildfires 881
Mass Movement 100
TOTAL 452,602

Droughts and floods have historically been the most deadly natural calamities.

However, compared to earthquakes, which are by far the most lethal natural disaster in modern times, deaths from these events are presently comparatively low. Earthquakes killed 267,480 people globally in the last decade, followed by excessive heat, which killed 74,244.

The Number of People Killed in Natural Disasters Is Declining

Is the planet Earth truly more dangerous than it has ever been? Let's have a look at the statistics:

The Decline of Deaths from Natural Disasters

Natural disaster deaths have decreased dramatically over the previous 100 years, as shown in the graph above.

Natural disasters claimed the lives of about 500,000 people every year in the 1920s. Several outlier occurrences contributed to this: for example, a 1923 earthquake in Tokyo killed over 146,000 people, while drought and hunger in China killed 3 million people between 1928 and 1930.

Although the number of deaths fell below the 500,000 per year average in the 1930s, a number of incidents tipped the scales. Floods killed about 3.7 million people in China in 1931, and an earthquake in Pakistan killed up to 60,000 people in 1935, and so on.

Fortunately, the decadal average has declined to less than 100,000 deaths each year throughout time. When the pace of population growth is taken into account, the fall during the last century is much more striking.

Natural catastrophe awareness has risen substantially in tandem with global access to real-time information, and these occurrences are thankfully less fatal than they formerly were.


Popular Maps